Minimalist Data Stack - Nasa data viz
Production-ready data visualization for NASA dataset
0.0
0 reviews•
Apache Airflow·
Snowflake·
dbt·
Grafana·
Python
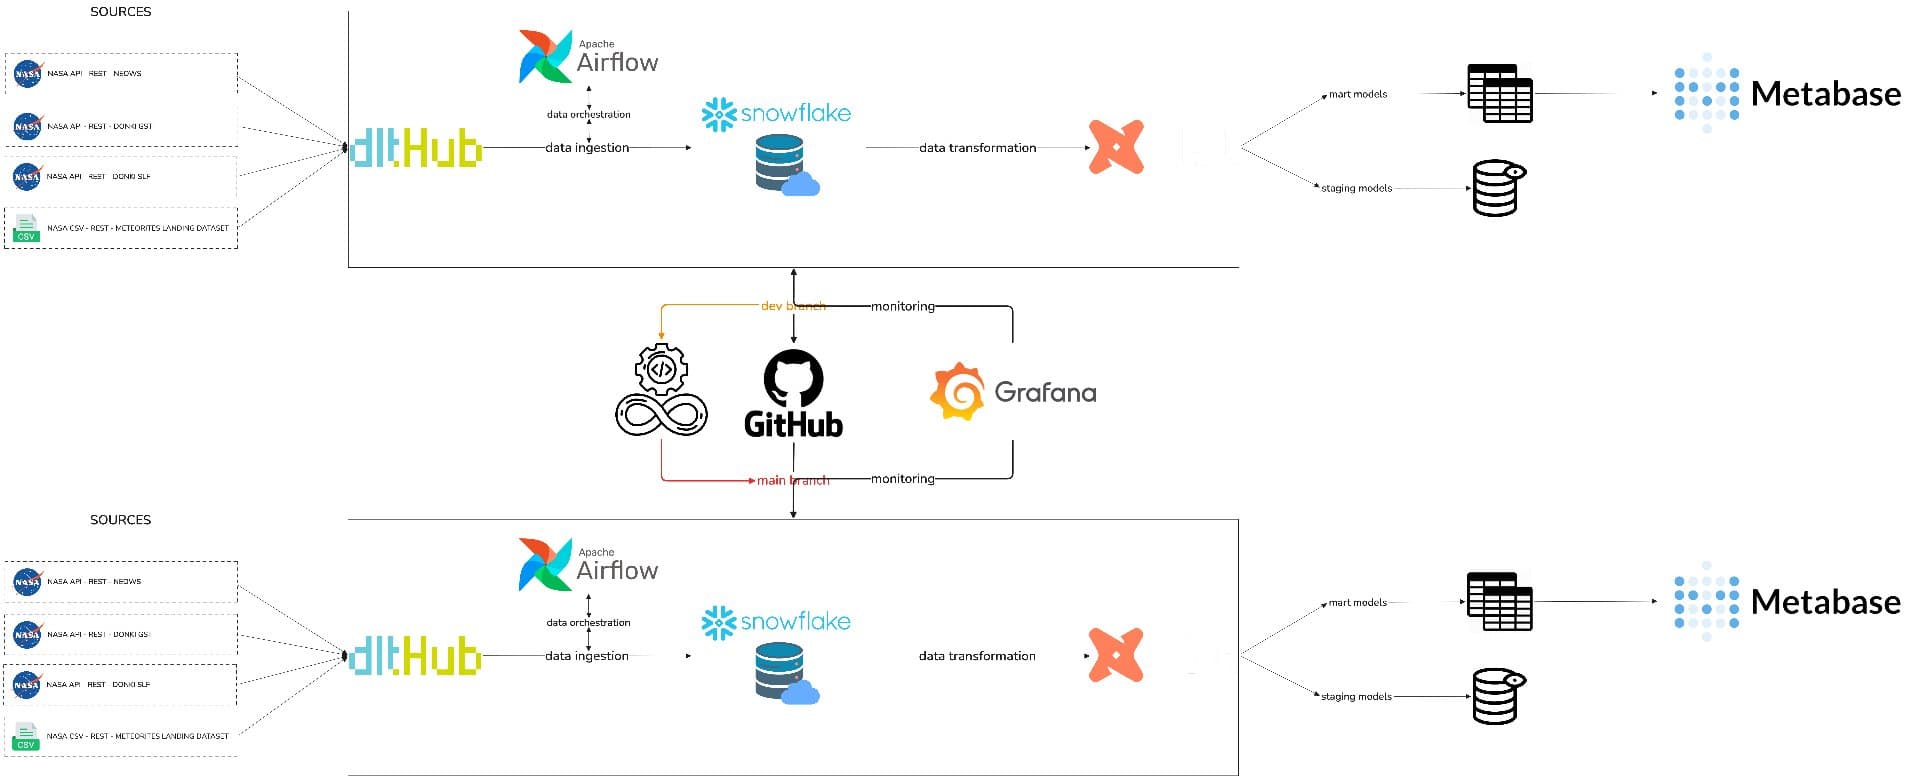
NASA Analysis — End-to-End Data Engineering ProjectNASA Analysis is a fully orchestrated data pipeline that collects, transforms, and visualizes NASA space data from three domains: near-Earth asteroid...
About this project
NASA Analysis — End-to-End Data Engineering Project
NASA Analysis is a fully orchestrated data pipeline that collects, transforms, and visualizes NASA space data from three domains: near-Earth asteroids, solar flare activity, and historical meteorite impacts.
Tech Stack
Ingestion: Python scripts pulling data from NASA's public APIs
Orchestration: Apache Airflow (via Docker Compose) scheduling and managing DAGs
Data Warehouse: Snowflake as the central storage and analytics layer
Transformation: dbt for staging, modeling, and testing data within Snowflake (medallion/layered approach)
Visualization: Metabase for dashboards & Grafana for monitoring
CI/CD: GitHub Actions with Ruff for linting and automated tests
Containerization: Docker Compose to spin up the entire local environment
How It Works
Airflow DAGs trigger Python extraction scripts that call NASA APIs and load raw JSON data into Snowflake.
dbt models clean, join, and aggregate the data through staging and mart layers with built-in tests for data quality.
Metabase connects to Snowflake to serve interactive dashboards (e.g., meteorite landing maps, asteroid proximity charts, solar flare timelines).
Grafana provides pipeline observability and monitoring.
Key Highlights
Clean project structure: dags/, dbt_nasa/, utils/, config/, tests/
Environment-based configuration (.env.example provided)
Reproducible with a single docker-compose up
Automated code quality checks via GitHub Actions + Ruff